Nifty__
Nifty__
View this project on GitHub
One of the main tasks of the international AUVSI Robosub competition involves locating the source of an acoustic underwater pinger. This pinger is mounted somewhere on the floor of a 100m wide pool. It emits a 20-30kHz ping every 2 seconds for a duration of 1.3ms. The high level task is to use this ping signal to guide the AUV to a specific location in the pool.
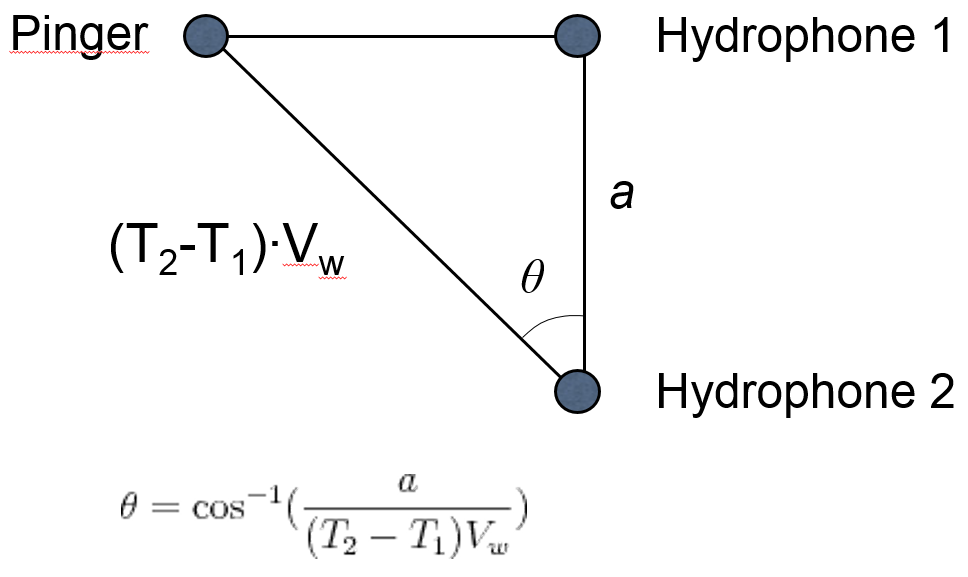
Our approach was to use an array of three hydrophones oriented in a precise geometric configuration, then use angle-of-arrival calculations to determine the direction of the ping source. To do this, we needed to ensure a clean analog signal from the hydrophones. A custom PCB was designed to perform high speed signal conditioning and data acquisition. This data could then be processed with a series of filters and phase comparisons, which result in ping detection and calculating a desired heading for the AUV.
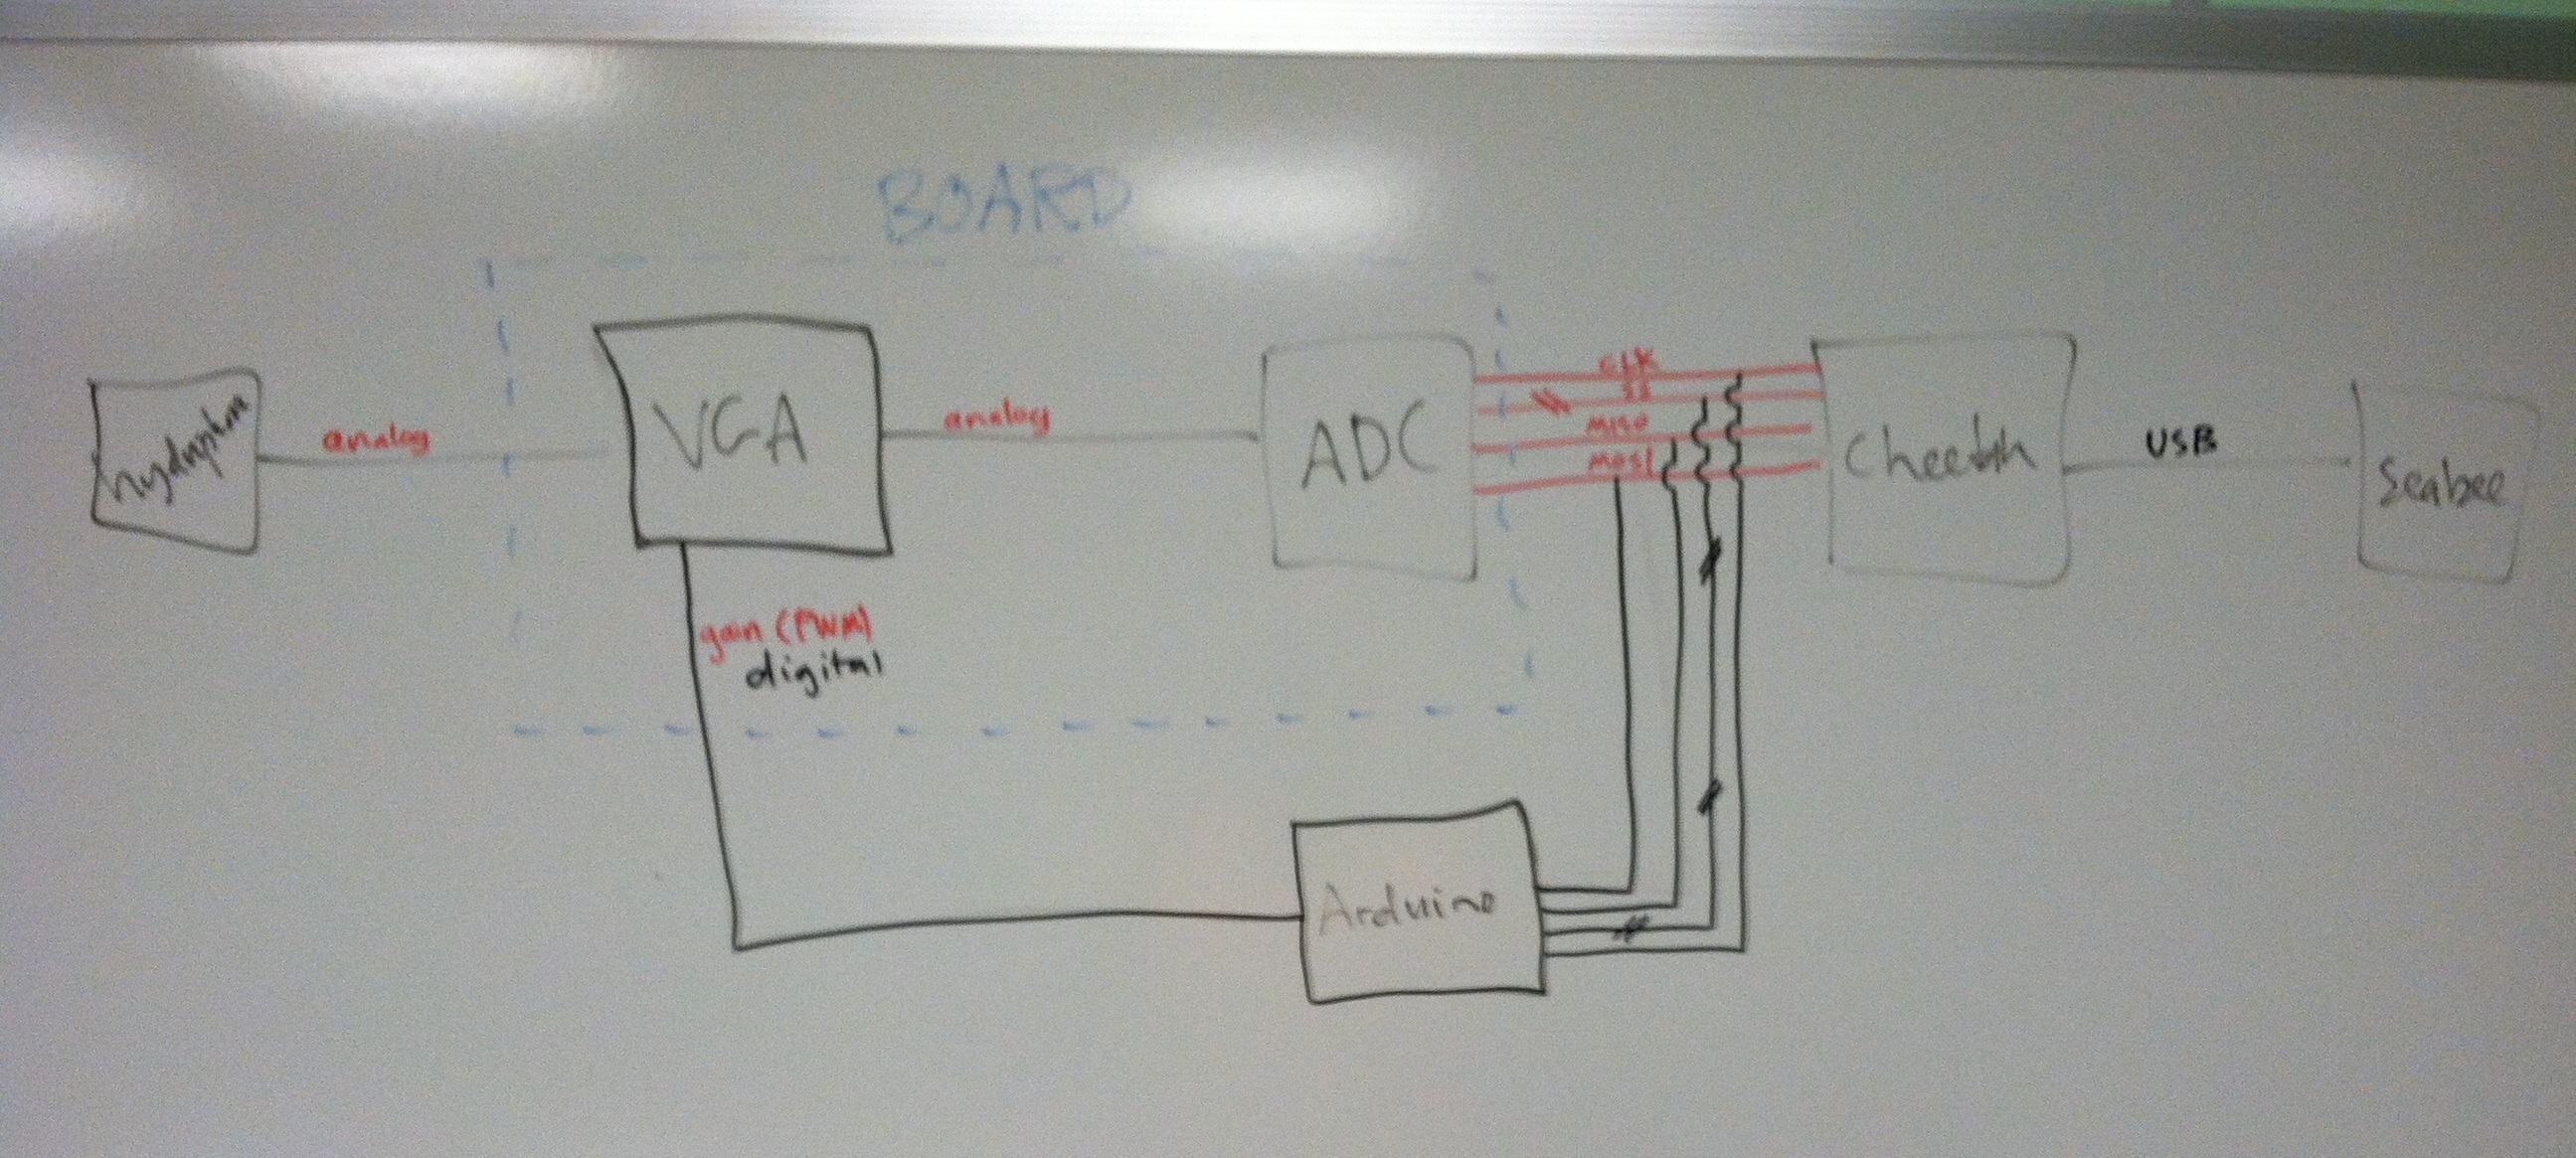
Because this project spanned the mixed signal domain, a lot of prototyping and testing was done to ensure functionality. Below is an early stage whiteboarding of the signal path, from hydrophone input to robot actuation.
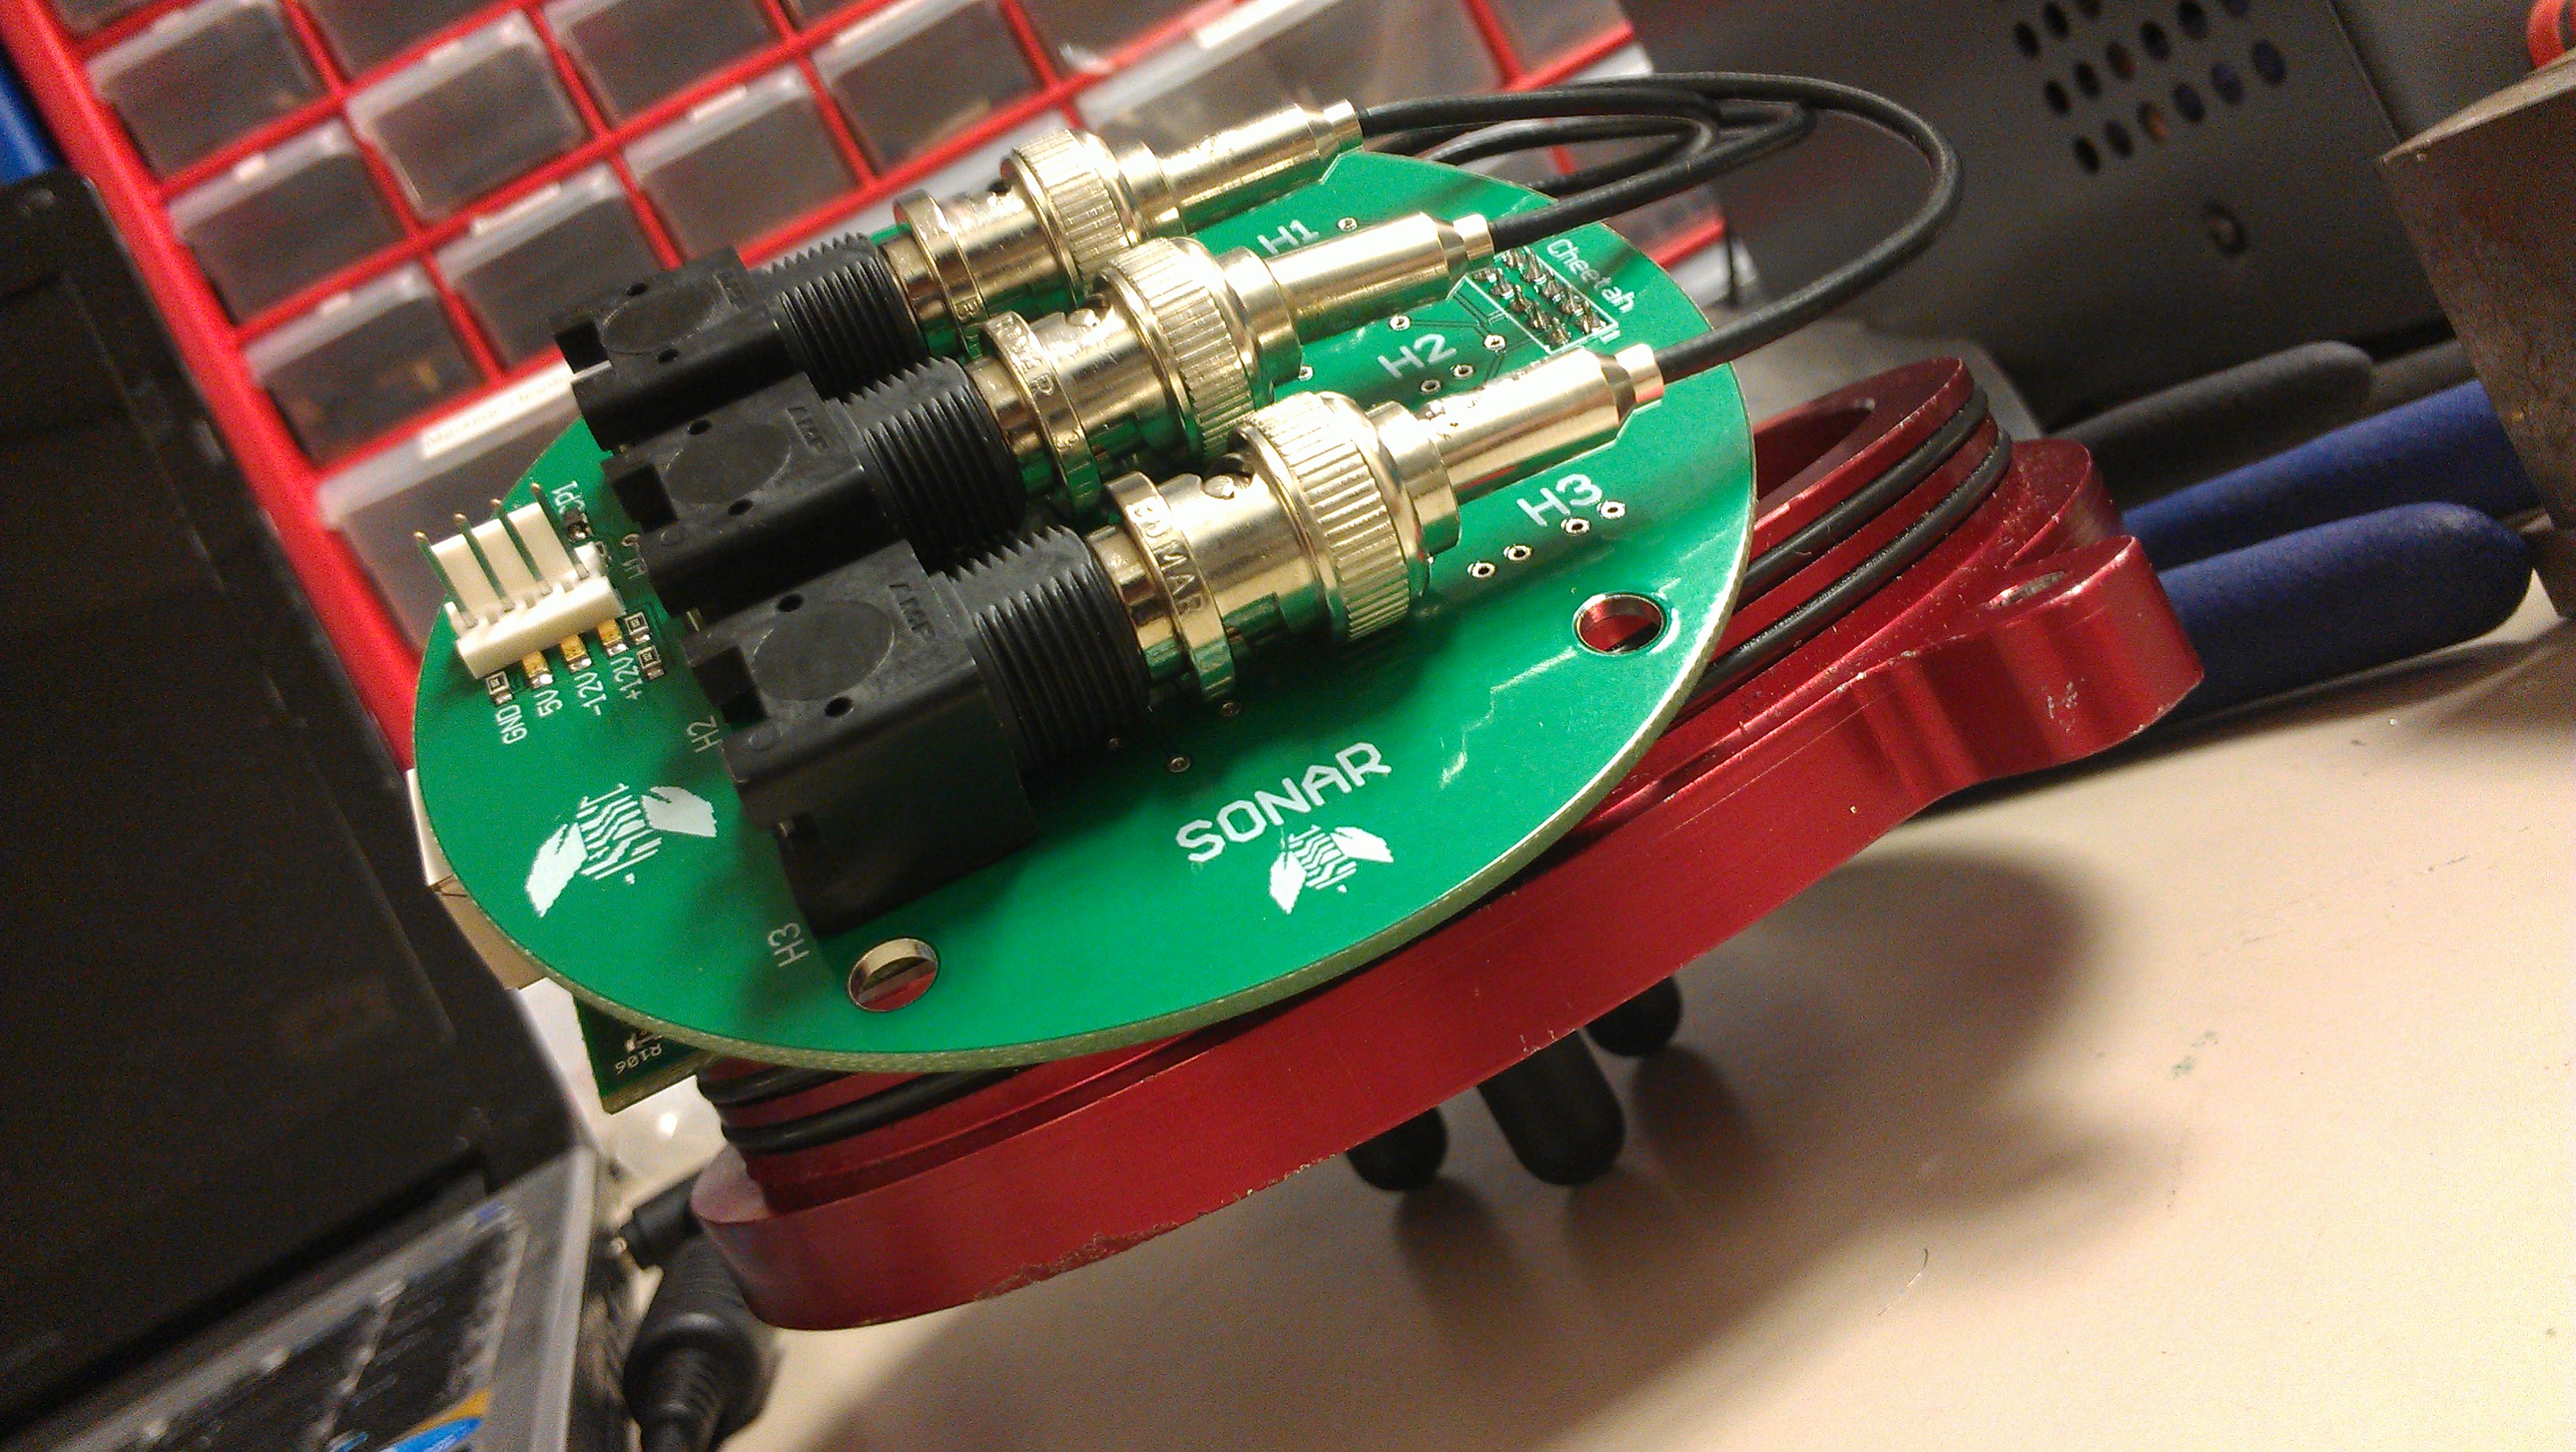
Like most electronic components on the AUV, the hydrophones and sonar board are housed in a double o-ring sealed cylindrical aluminium enclosure. Waterproof Fischer connectors are used to interface the power and data signals of the sonar board with the main CPU. The enclosure and hydrophones are mounted in an equilateral triangle configuration at the bottom of the AUV.
A previous approach to the passive sonar project involved using a triangular array of 3 hydrophones and passive electrical components to isolate and amplify the energy of a wave packet. The signals from the hydrophones were digitized using ADCs, and a Cheetah SPI Host Adapter (an off-the-shelf high-speed communication tool for facilitating the data streaming over an SPI serial bus). The digital information was processed by a microcontroller for its frequency content, and a ping-detection algorithm was used. This involved extracting the phase information and converting the time-difference-of-arrival into an angle towards the pinger. The main issues were signal strength and signal noise, as there appeared to be a lot of interference and cross-talk.
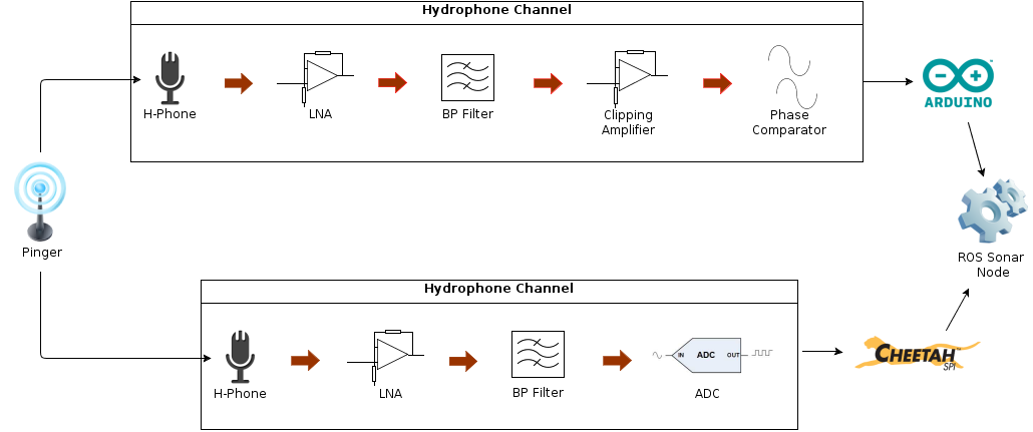
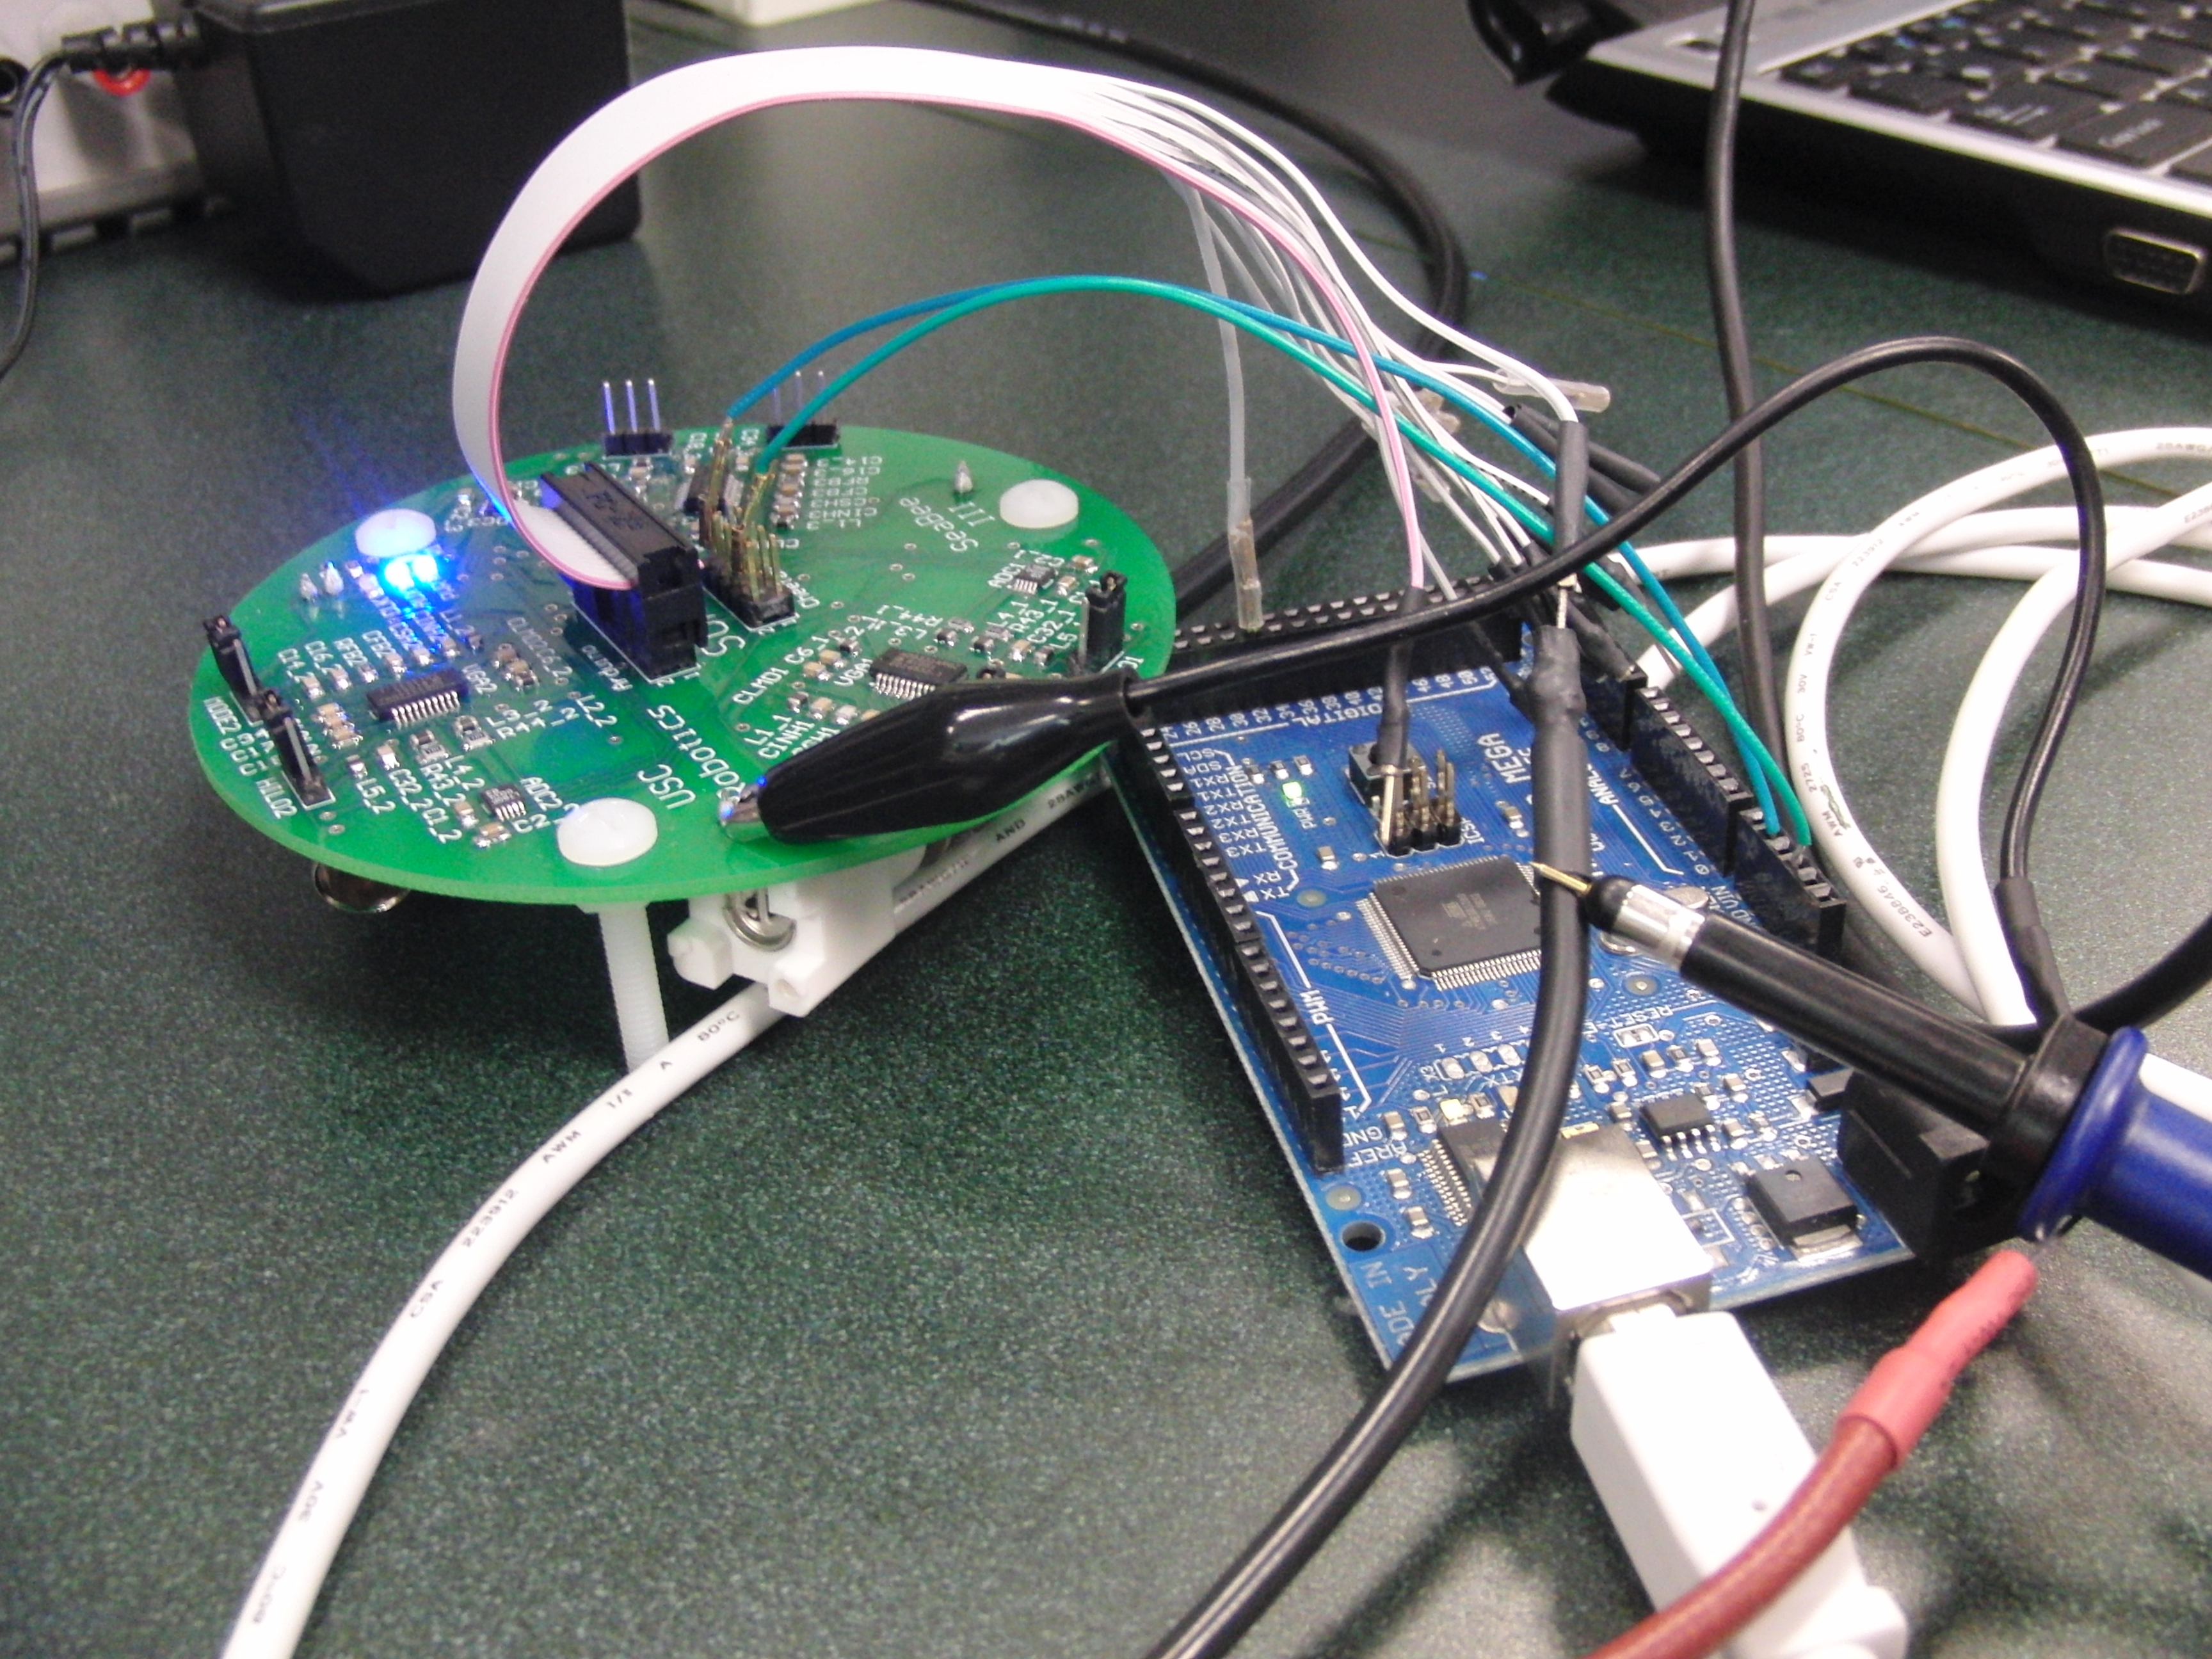
This time around, we are exploring two different approaches. One approach uses a narrow switched capacitor bandpass filter to isolate the 20-30kHz ping signal, an high-gain amplifier to clip the signal (essentially turning it into a square wave), and a phase comparator to determine the phase differences between the different hydrophone channels. The phase comparators will output a pulse width proportional to the phase difference, which is then read by an Arduino microcontroller.
The second approach is an analog frontend improvement of last year’s Cheetah solution. The grounds of each hydrophone channel will be kept separated, and differential-pair hardware will be used to reduce the interference, cross-talk, and external noise. The signals from the hydrophones can be very weak so a low-noise preamplifier will be used to boost and condition the signal for the bandpass filter. Also, faster and more precise ADCs will be used, and a fourth hydrophone will be incorporated into a tetrahedron-like configuration to add another dimension to our calculations.
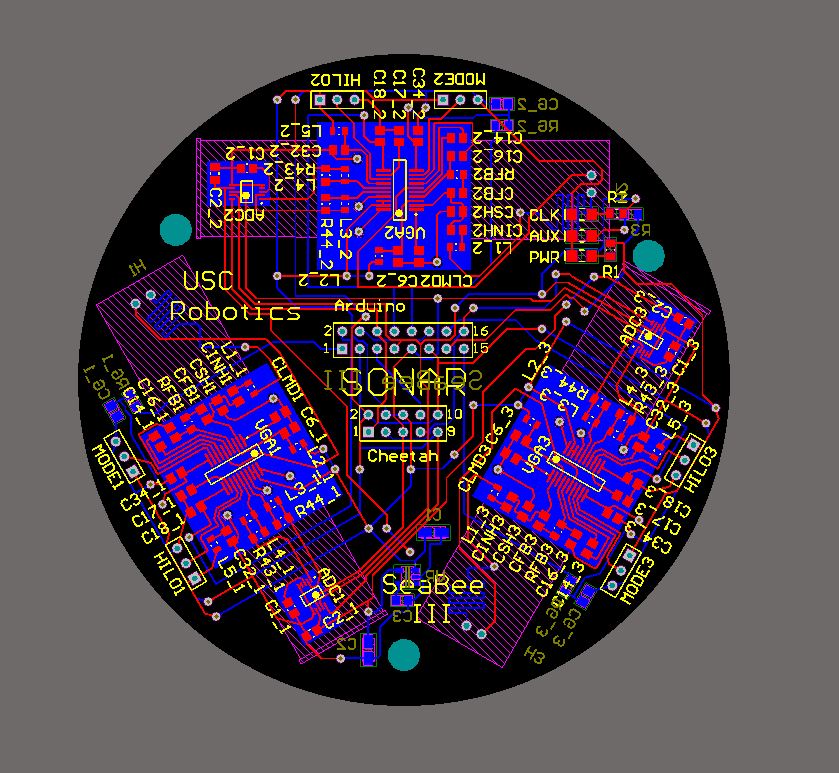
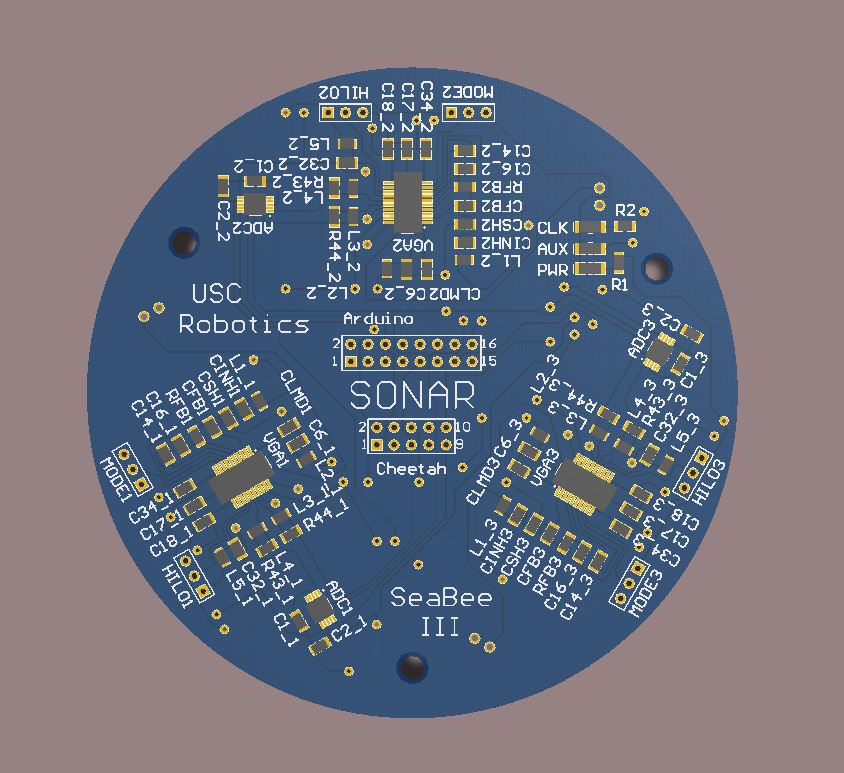
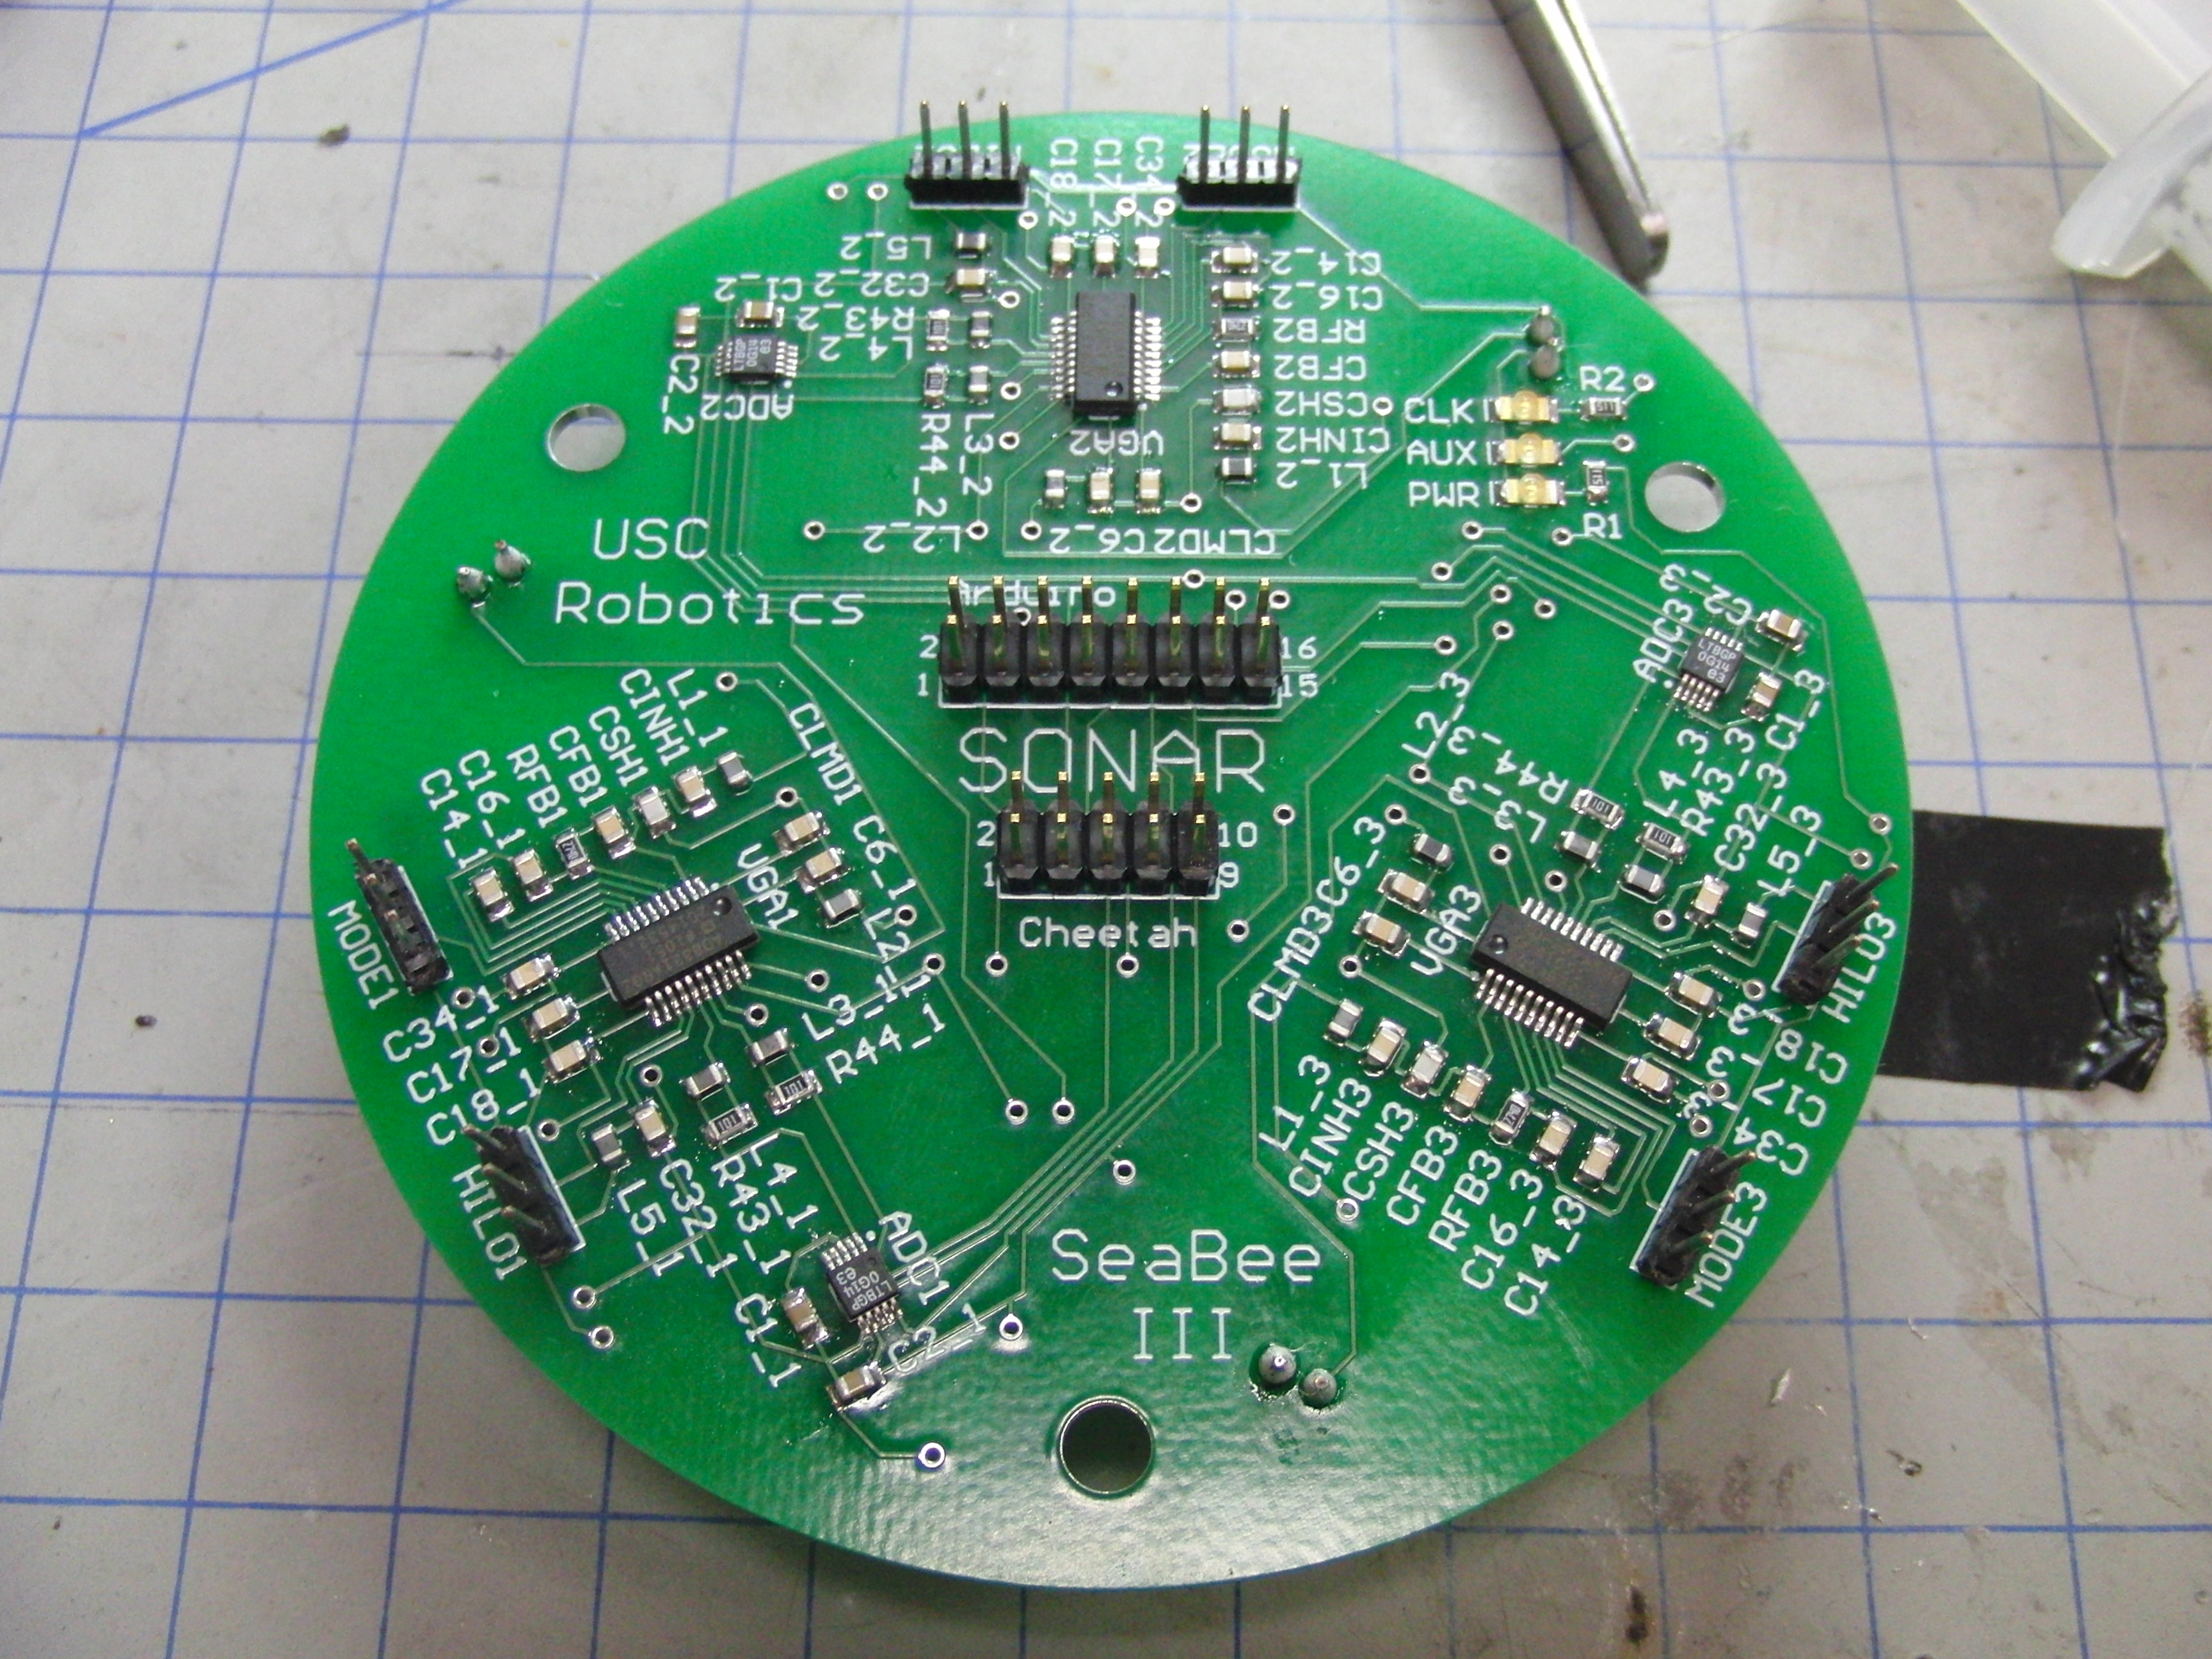
A circular PCB was designed to fit into the small cylindrical enclosure and interface with all three hydrophones. One prototype is shown below from layout to board bringup.
Because the AUV ran on a ROS framework, the sonar node was written to post ROS messages to indicate signal strength and direction. The sonar software took many sample conversions from the ADCs through the high-speed SPI buffer on the Cheetah. The data points were analyzed for their frequency content using a digital fast Fourier transform and bandpass filters.
Here, some test data was saved into a CSV text file and plotted in Octave. The “Overlay” plot represents a phase comparison of the input subplot signals.
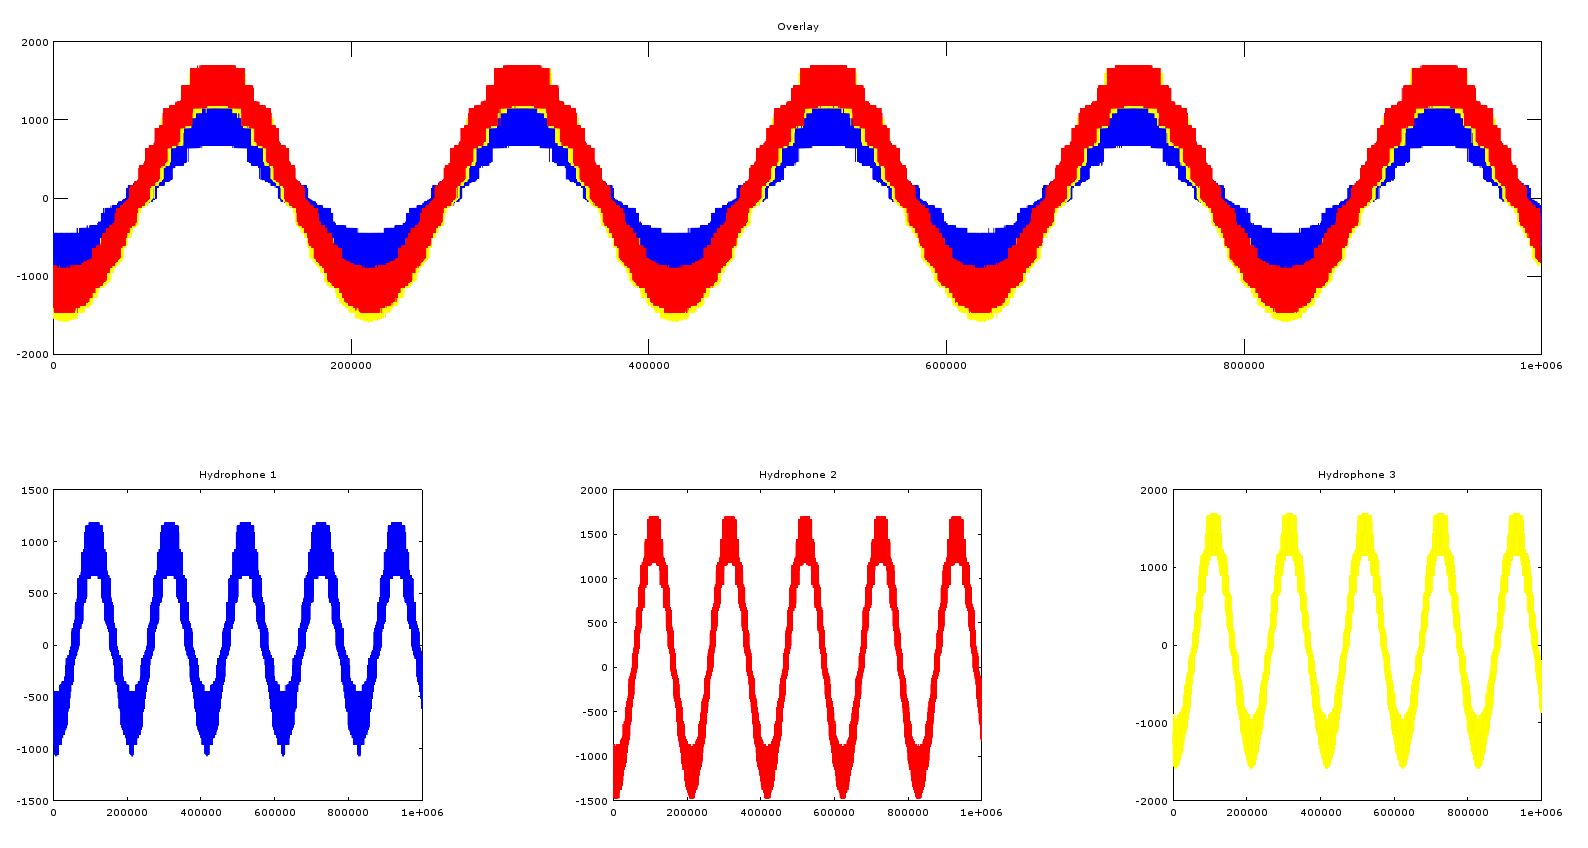
A windowing time binning algorithm was used to determine if the signal was indeed a ping. Using all data input streams from the three hydrophones, the signal phase can be compared to determine an angle-of-arrival.
Passive Sonar PCB by hieu on Sketchfab