Nifty__
Nifty__
View this project on GitHub
The U.S. Department of Energy has invested over $120 million to the research and development of a regional “smart grid” in Los Angeles, California. This advanced metering infrastructure would use smart meters and grid sensors to monitor and control electric utilities—essentially building environments that can regulate themselves, balancing occupant comfort with energy usage.
In order to evaluate smart grid technologies, the University of Southern California (USC) campus is serving as a micro-grid test-bed for the Los Angeles Smart Grid project. The USC campus contains over 33,000 students and 13,000 faculty members, who collectively consumed 148GWh in 2010. With a dense population and over 100 major buildings, the USC campus forms a “city within a city” and is an ideal testing ground for running smart grid experiments. Currently, each building has the ability to measure its total energy usage at 1 minute intervals, while newer buildings have room-level or equipment-level energy usage measurement granularities. In order to handle the vast amount of sensor data (~3TB/day), a scalable cloud infrastructure has been proposed, but that (big) data still needs to be effectively organized, manipulated, and communicated to users.
Mobile applications provide an interactive and educational experience that has been found to be more engaging and effective than traditional web-based applications. This project implements an Android app that works with cloud services to encourage sustainability and energy conservation at USC, transforming smart grid sensor data into useful knowledge formats. It was developed in the spring of 2012 for USC’s Parallel and Distributed Computing (EE-657) course taught by professor Kai Hwang. Technical guidance was provided by professor Yogesh Simmhan. Read a more detailed description of this project here.
For most utility providers, power usage information is only available to the customer once a month through paper billing statements. With a smart grid, however, power usage can be measured on the order of minutes. This helps utility providers balance demand, reduces expensive peak power usage, and allows customers to see and respond to real-time pricing information. In addition to the data collected from meters and sensors, the smart grid also aggregates data from diverse sources of information such as weather, traffic, event schedules, and social networks. With data mining, pattern recognition, and decision making algorithms, the smart grid will continuously learn and leverage human behavior/context to dynamically mitigate energy use.
To handle the computational load and vast amount of data, a scalable cloud infrastructure has been proposed to collect, manage, and manipulate the information. Clouds provide a flexible model for processing and data storage over time, allowing virtual compute resources to be acquired on demand and released when no longer required.
For this project, cloud services provided through the Amazon Web Services (AWS) platform were used. The back-end consisted of Elastic Compute Cloud (EC2) free-tier micro instances to host an Apache2 PHP webserver on a 64-bit Ubuntu Oneiric Server AMI. The micro instances provide moderate baseline performance on a 3.3GHz Intel Xeon processor with the capability to burst to significantly higher performance as required by workload, allowing scalable deployment of applications by virtualizing compute resources. This is useful as the amount of moblie app user activity scales up and down.
Other AWS services used include SimpleDB and the Simple Storage Service (S3). The AWS SimpleDB is a distributed NoSQL database service that allows storage, transfer, and throughput over the Internet. In this implementation, SimpleDB is used to store user data and preferences for use with the smart grid. Amazon’s Simple Storage Service (S3) provides a fully redundant data storage infrastructure for storing and retrieving any amount of data through web service interfaces. Amazon S3 is used to store the users’ server-generated energy usage graphs.
On the front-end, an Android mobile application was developed and tested on a rooted HTC Amaze cell phone. The mobile app took advantage of the phone’s access to the Internet (through WiFi or mobile network data), its touchscreen interface, and location services (through GPS module).
By giving consumers more information about their energy footprint and the means to manage their electricity consumption, the smart grid can provide real-time situational awareness and influence more energy-efficient consumer behavior. This mobile app serves as a management console for a user’s utilities, allowing users to manually control powered devices from their phones, view energy usage statistics, and participate in communal energy-saving initiatives.
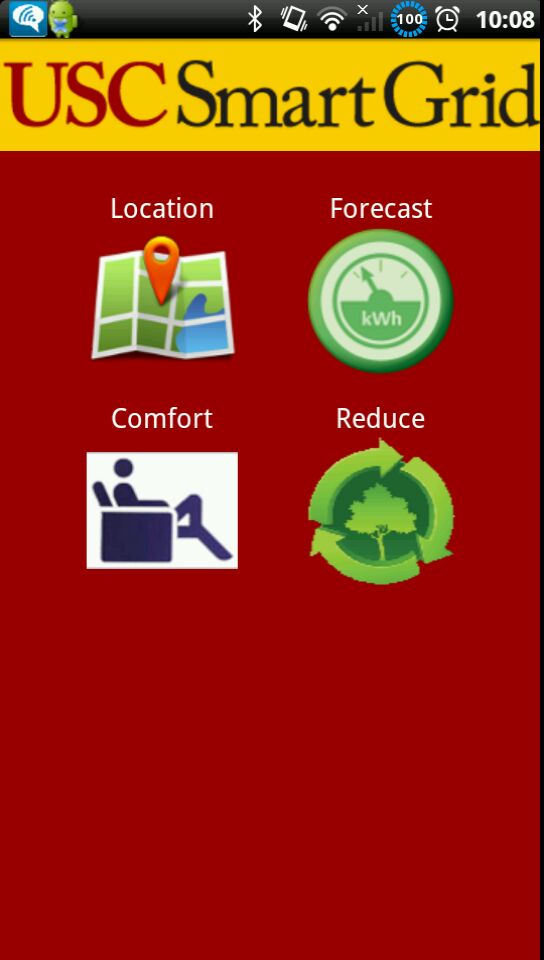
The USC Smart Grid App has four modes of operation called “Location”, “Forecast”, “Comfort”, and “Reduce.” These four features provide the user with a basic bidirectional interface to the USC smart grid’s information. Utilizing cloud services, this mobile app provides scalable operations in an information-rich environment, allowing distributed stream processing for low latency response.
Overall, the app makes it easier for consumers to comprehend and interpret their energy usage and configure their home or building area networks to be controlled by the smart grid on their behalf.
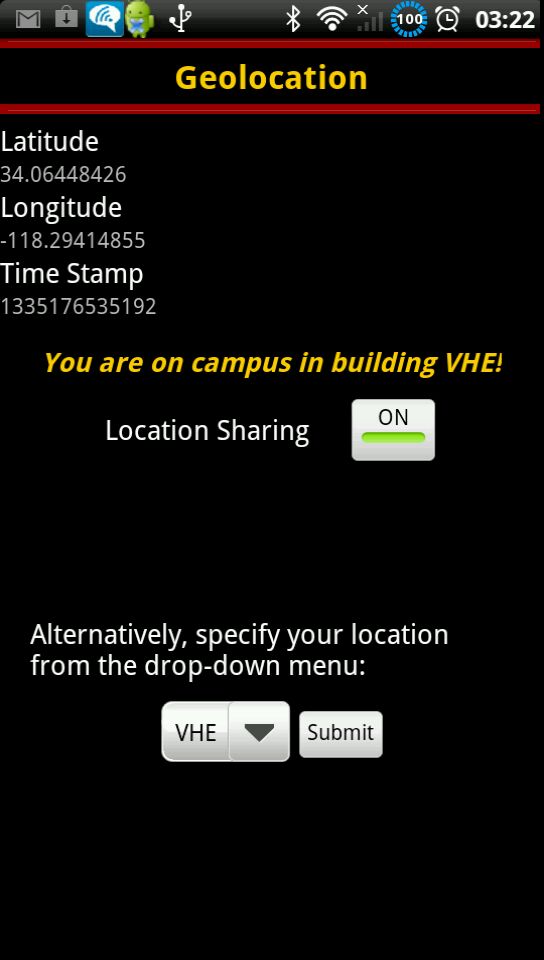
As people migrate or relocate within the USC campus, the smart grid will need to adapt to better serve its customers. The location activity on the USC Smart Grid App is responsible for keeping track of the user’s location, allowing a more personalized carbon footprint monitoring. By knowing the room or building a user is located, the smart grid can access the associated usage statistics and present the user with location-specific energy conservation information.
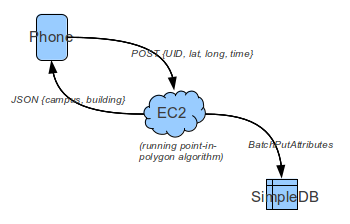
Using a cell phone’s GPS, the user can share his/her geolocation with a cloud database. When the user turns on ”location sharing”, the app will post the latitude and longitude to the EC2 server every 15 minutes. The server runs a point-in-polygon algorithm to determine if your coordinates are located within a particular building, then puts this information into SimpleDB. Alternatively, you can directly specify what building you are in. This is useful because sometimes it is difficult to get an accurate GPS reading while you are indoors.
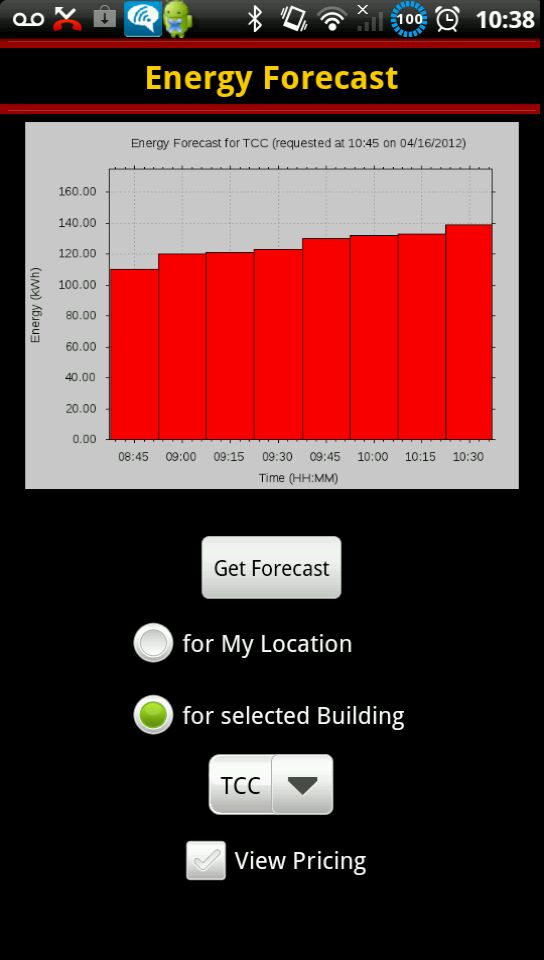
The forecast activity enables users to view energy usage statistics with interactive and eye-catching plots, charts, and forecasts. This feature interfaces with the sensor-data-logging database to obtain the energy usage kWh-readings for a particular building. Using this information, the smart grid can apply demand forecasting to accurately predict the occurrence of a peak load—a situation where the demand for power approaches or goes beyond the current power generation capacity of the utility.
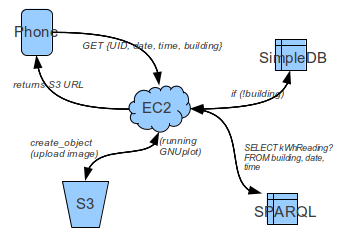
When a user clicks “Get Forecast”, the mobile device sends an HTTP GET request to the EC2 server. This request includes the date and time of the request, as well as a user ID and building. If a building was not specified, the server retrieves the user’s previous location data from their entry in SimpleDB. Then using the building, time, and date, the server queries another database that holds the live kWh measurements. A plot is generated with the query response and that image is uploaded to Amazon S3 cloud storage. When the S3 upload is complete, the server returns the URL to S3 object to the USC Smart Grid App, which can then download and display the image.
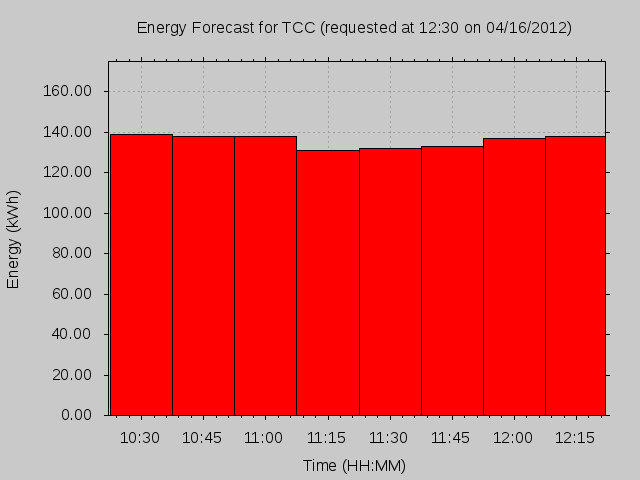
Users can also use the forecast activity to view their energy usage history. The bar graph below shows the usage history in the past 2 hours at 15-minute intervals for the Tutor Campus Center (TCC). The plots provide customers with a visual interpretation of data to showcase trends and patterns over time.
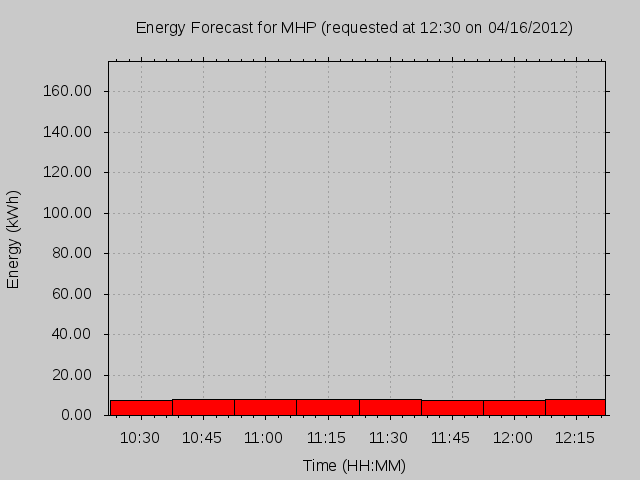
Here is another plot of the usage history for a different building—Mudd Hall of Philosophy (MHP)—for the same period in time. Comparing these plots, it is easy to see that this building of classrooms uses much less energy than the campus center, which contains a full-service food court during the lunch rush.
The comfort activity presents an environment where users can inform the smart grid of their personal preferences. For example, a customer can use the app to tell the smart grid that he/she is feeling quite cold. This comfort preference is consequently updated in SimpleDB, which keeps track of all of the user’s information in the database. The smart grid can then evaluate the user’s preferences and location to develop a strategy for optimizing user comfort with energy usage—perhaps automatically raising the regulated temperature in the room to reduce HVAC usage and warm up the customer.
The USC Smart Grid App utilizes a third-party mobile backend-as-a-service called Parse to facilitate the push notification channels and handle the message passing. Every time a user’s comfort level or location changes, the app subscribes to the corresponding push notification channels. This enables the application to contact a subset of users who are feeling cold, or are located in a particular building.
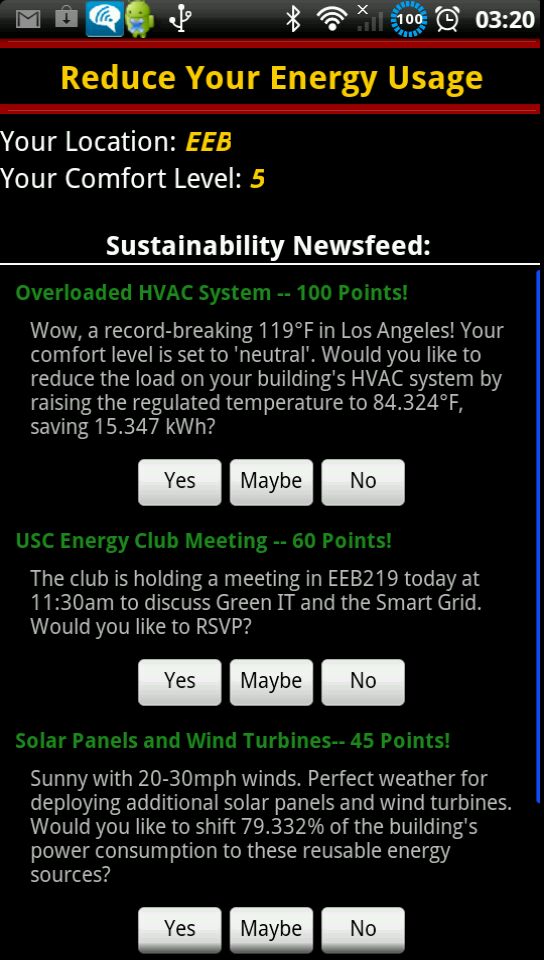
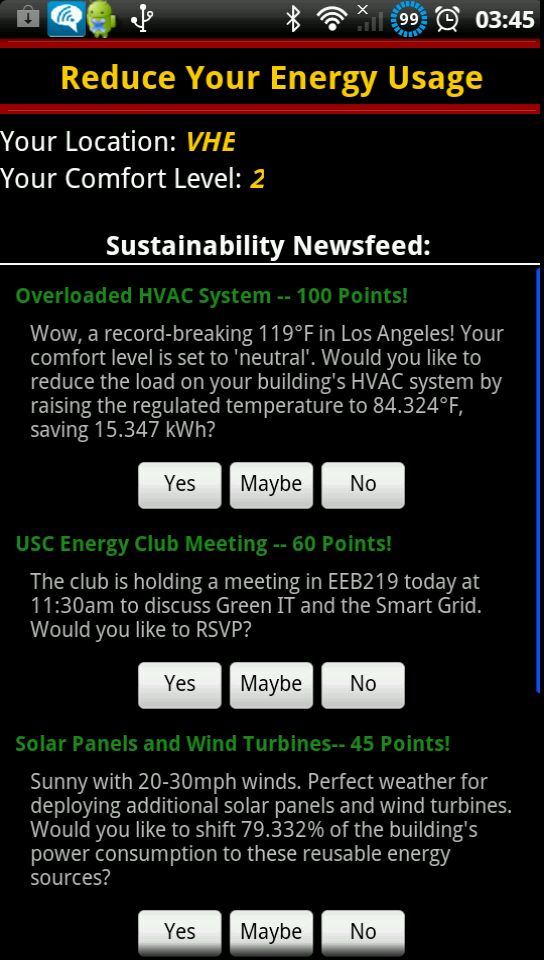
The reduce activity accesses the user preferences and location to generate a personalized sustainability newsfeed unique to the user. Newsfeed content could include predicted information and advice on how consumption could be reduced, friendly reminders with accompanied expected energy savings, positive encouragement to encourage voluntary reduction, explanations of usage graphs, or possible reasons for high bills. The reduce activity is essentially a strategic way to present interpreted information to the customer.
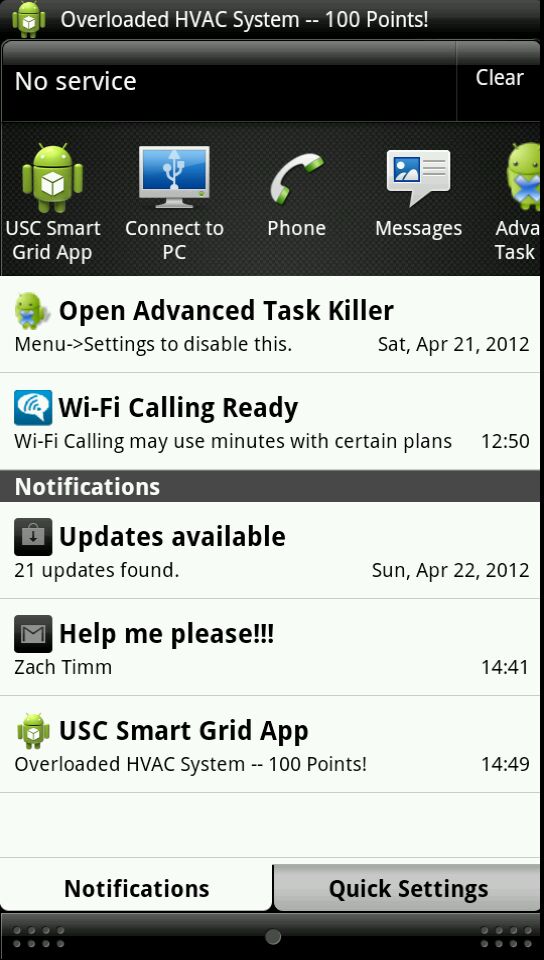
A push notification is sent, appearing in the task bar of a user’s phone. When the notification is opened, the Reduce activity starts up. This feature keeps track of your location and other user preferences to generate a personalized sustainability newsfeed. Tasks are assigned point values as an incentive for users to participate.
By presenting the smart grid information in a natural language, consumers may find it easier to comprehend and interpret than the structured data presented in the form of tables or graphs. Thus, the reduce activity and its sustainability newsfeed allow a unique communication between the smart grid and the consumer, personalizing requests and determining incentives that work best for different demographics and for different consumer categories such as residential, commercial, and industrial. By educating the consumers about load curtailment benefits, sustainability and energy conservation can be optimized based on the user’s preferences.
There are a lot of areas for future work that need to be explored. These are things like improving the user interface, adding extra functionality to the app, and using the elasticity of the cloud to handle high demands and reduce latency.
With a mobile application, one concern is the request response latency. As the number of users increase, the number of requests to the server increase and scalability becomes an issue.
Here is a list of some technical ideas to explore: